
This article by Sue Littleford, for our regular Flying Solo column in member newsletter The Edit, looks at how to use Excel’s filter function to help you decide how much you’d like to be paid and how long you need to do the work. It also considers some other decisions you may want your records to help you with.
 The Going Solo Toolkit contains a spreadsheet for you to record your work (available to CIEP members only). There’s an older, simpler work record available, and I daresay many people have devised their own record-keeping system.
Everything you could ever want to know about calculating a price for a job is covered by the CIEP guide Pricing a Project: How to prepare a professional quotation by Melanie Thompson. So, this article is going to look at how to extract the information from records to help you arrive at a decision on how much you’d want to be paid, and how long you need to do the work, and then take a look at some other decisions you may want your records to help you with.
You already know that you need to record the work you do for your tax return, and you already know that if you record – or calculate – the right detail you can use that record to inform your estimating and quotes for jobs, both in time and in money.
But I know that many people struggle a bit with using Excel, so how on earth do you get the information back out of the spreadsheet? The more data you have, the more useful your records should be, but the more data you have, the harder it can be to see at a glance what you want to find out.
The filter
I’m going to talk about just one tool in Excel: the filter. Once you get to grips with it – and that won’t take long – you can use that same tool over and over, layering it up, even, to get an analysis out of your records of whatever information you’re focused on.
You can, of course, sort your rows of data in order, just as you can in Word, but the filter doesn’t disturb the original order of your spreadsheet, and enables you to do what amounts to multiple sorting, so it’s more powerful and less bothersome, which is why I use it so much.
I’m going to make a big assumption and show examples based on the Work Record spreadsheet from the toolkit. The principles are exactly the same, as long as you keep your records in Excel. If you keep your records in Word or on paper, you won’t have access to these features. Perhaps this article will encourage you to give Excel a try!
The screenshots here are taken on a PC running Office 365. For simplicity’s sake, I’ve hidden a few columns.
If you use a Mac, the principles involved are still relevant to you, and I’ve linked at the end to some YouTube videos, and Microsoft articles, on filtering for both Macs and PCs.
Right, to business.
The filter is your best friend when it comes to interrogating your spreadsheet. It’s in the Editing group on the Home tab, and it looks like this: ![]() Click on it, and you’ll see this:
Click on it, and you’ll see this: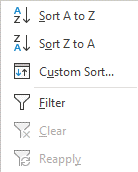
The filter lets you select all records in a column with a particular value, but you can be a bit fancy about the values you use.
Let’s keep it simple for now.
The handiest way is to make the filter available on every column in your spreadsheet. You can do it the really easy way, and just click at the top left corner where the row labels meet the column labels, where the little triangle is: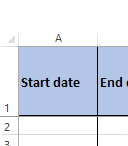
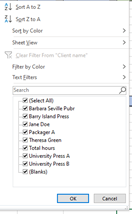
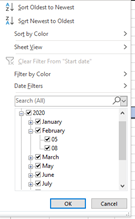
Then click on Sort and Filter, then Filter, as you can see in the first two screenshots. A little down arrow will appear at the top of each column (you can’t filter by rows), and they look like this: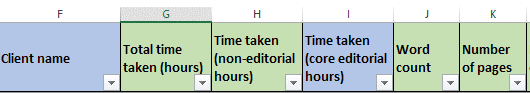 Click on any of those down arrows and you’ll see you get a list of the unique entries in that column – and if you’re looking at dates, you’ll get a family-tree-like menu with checkboxes, so you can select by year, by month or by day.
Now you’re cooking!
Select an item, and your spreadsheet will now show you only the rows that match that selection. So you can filter by client, by type of work, by fee earned, by imprint, by word count, by rate per hour …
Coming to a price – or evaluating a proffered fee
Suppose you’re asked to do a copyedit of 75,000 words. To get a feel for how long that takes you, and how much you’ll want to charge, you may decide to filter your records to jobs in the range 70,000–80,000 words.
This is the starting view of the spreadsheet I mocked up for this article: Clicking on the little down arrow at the head of the word count column will give you a list of the unique values in that column, sorted in ascending order:
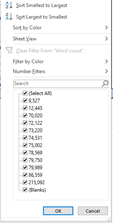
Now you have a choice of how to proceed. You could simply uncheck the (Select All) box, then either click every value between 70,020 and 79,989 words, or you could click on the Number Filters option, just above it.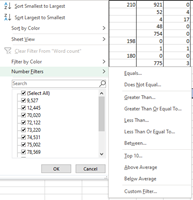
That gives you more options: above average, below average, Top 10 … but let’s keep to the immediate job in hand. You want to filter on the jobs you’ve already done, between 70,000 and 80,000 words. So click on the Greater Than option: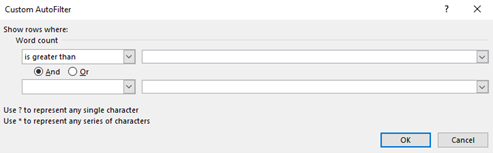 type 70000 in the first box, keep the And radio button selected and then use the short drop-down box beneath to select ‘is less than’ and type in 80000:
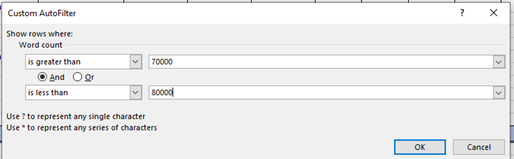 and click OK. The box will disappear and you’re left with a list of rows of data where the word count falls between those two values. As you can see, the original row order is preserved.
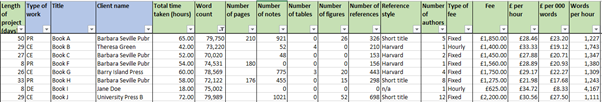 You can stack up filters, so can filter down to just proofreading jobs or just copyediting jobs, or just developmental editing jobs, or what have you. Because I’m currently assessing a copyediting job, that’s what I’m going to pick.
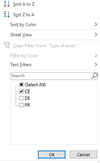 And that shrinks the list further, to:
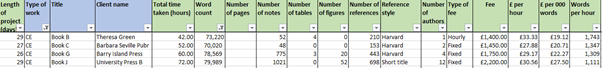 Now you can easily see what you’ve earned before doing copyediting for that kind of word count. You can see jobs ranging from 48 to 1,021 notes. What about the job you’re assessing? Where does it fall on this spectrum? You can see that jobs had few tables, but up to 52 figures, and you had a mixture of Harvard and short-title referencing. You can see how many days overall the project took, how many hours, what kind of speed you were achieving and whether you had a large number of authors or just one.
If you work in fiction, or in some trade nonfiction, you may have no notes, no references, and quite possibly no tables or figures. But you would still see your editing or proofreading speed, what you got paid and how complex the job was.
Whether you use just one filter, or whether you stack them, you do need to turn them all off once you’ve finished, or risk being really confused next time you open the spreadsheet, with a chunk of your data apparently missing (I speak from experience!). You can see which column(s) a filter is active on as it changes from the simple down arrow you’ve already seen to this, a down arrow alongside the filter symbol: ![]()
You can see it in situ on the type of work and word count columns. Click on each active one and select the ‘Clear filter from …’ option, or to clear all the filters in one action, go back to the original Sort and Filter button and click on it, then either on Filter (to toggle it off) or on the option below, Clear.
Establishing a probable duration
Using these same principles, you can estimate how long the job is likely to take you. In the last screenshot of the filtered spreadsheet, you can see the words per hour range from 1,111 to 1,743. You still have the information about complexity – referencing, notes, artwork – so how does that stack up against the job you’re evaluating, or quoting on? Are you likely to be nearer the lower or upper end of this range?
When you’ve worked out how many hours you’ll probably need for the job, you can then see when and whether the job will fit in your schedule, assuming that the quality of the raw manuscript isn’t significantly different from the manuscripts you’ve already edited or proofread. That’s a big assumption, so think about that, too, when you’re looking at the sample to provide a quote, or the full manuscript to decide whether the fee being offered will be enough.
At the left-hand side of the spreadsheet, you have the number of elapsed days that the previous jobs took. That will also help you decide whether you can take the job on: how well does it fit in your schedule? And what else is happening at that time? Do you have some other commitments in your diary? Did you plan on taking some time off?
Incidentally, I’ve personalised my copy of the spreadsheet and include a column for days worked, too, that I take from the time-log for the job. I can then tell whether I was all-hands-to-the-pump or whether I was working at a more sedate pace. For the first job in the screenshot, 29 days elapsed from starting work to finishing it. But did I actually work 15 days, 20 days, 29 days of the 29? That will fine-tune the information and help me decide whether I can fit the proffered job in the timescale wanted.
I always give myself plenty of wiggle room when working for indie authors, particularly, and when necessary I negotiate with corporate clients on the deadline as well as the fee. Life happens, as the saying goes, so you want to have the time to do the work at a sensible and safe pace, and have some time in your back pocket for contingencies.
The information stored in your spreadsheet can support your quotations and evaluations, if you actively use it.
Who is my worst payer?
This is a question you should ask yourself at least once a year. And when you’ve found out who it is, in an ideal world you would fire them and make room for better-paying clients. You may have a sound reason to stick with a low-paying client, of course. Perhaps it’s work for a cause you want to support. Perhaps the work is really interesting, the deadlines are sensible and the client is a delight to work with. Then aim for the next worst-paying and fire them, instead! Don’t burn your bridges, though; just be ‘too busy’ the next time they ask so it’s open to you to accept work from them another time, if you need to or just want to.
Always take a look at the latest version of the CIEP’s suggested minimum rates, to inform your thinking.
But the first step is finding out who is your least-good payer.
The Work Record spreadsheet in the Going Solo Toolkit gives you two ways of looking at your earnings: per hour and per thousand words.
First, if you offer more than one service, you’ll want to filter by service: copyediting, developmental editing, project management or proofreading, for example. There’s no point comparing oranges with apples.
We’ve already seen that putting a filter on a column and then opening up the filter gives you the unique values in that column, listed in ascending order. That may be all you need. Select the lowest value – or two, or three or more – and see who those clients are. Or filter on numerical values, less than £x per hour, or less than £x per thousand words.
There’s an ultra-quick way of taking a look at how much your clients vary, though. Click on the top of the column to select it, and look in the status bar at the foot of the spreadsheet, towards the right side. If I select the £ per hour column in the spreadsheet I mocked up for this article, I see this:![]() That shows me that my rate per hour runs on a spectrum from £21.98 to £38.11, via an average of £30.28. If you do this on a spreadsheet of your own, and don’t get these values showing up, then right-click on the status bar and start ticking some of the options in the pop-up box:
That shows me that my rate per hour runs on a spectrum from £21.98 to £38.11, via an average of £30.28. If you do this on a spreadsheet of your own, and don’t get these values showing up, then right-click on the status bar and start ticking some of the options in the pop-up box: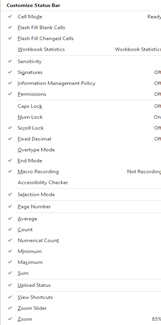 The ones you want are in the third section from the bottom of this list, from ‘Average’ to ‘Sum’.
Am I happy to be earning £21.98 per hour? What’s the minimum I want to accept from now on? Let’s say £27.50 for the sake of demonstration.
So on the £ per hour column, I set the number filter to ‘less than 27.5’, in the same way as before, and I get this result:
 I can see that the three clients who paid me less than £27.50 per hour are all different, and for only one job each. Two of the three worst payers per hour were for proofreading. But look at that difference in £ per 000 words: from £12.88 to £17.68, although the lowest rate per 000 words paid more per hour than the job below it. I can see that the good £ per 000 words job had a lot of references and notes, which would have slowed me down, and yes, that’s reflected in the words per hour column. Do I want to fire Barbara Seville? Let’s take another look at the data and filter just the jobs for that publisher, turning off the filter on the £ per 000 words column to get everything for that publisher:
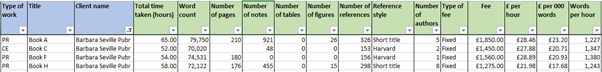 Now I can see that low fee in context. That low rate is looking like an anomaly, and all the other jobs I’ve done for them paid more than my line in the sand of £27.50 per hour. Maybe I’ll keep accepting work from Barbara Seville, but keep an eye on how the fees work out.
The worst payer of all was Barry Island Press, so let’s look at them in context. Clear the checkbox for Barbara Seville from the filter and tick Barry Island Press: I’ve only done two jobs for them, but I can see that their proofreading rate is a lot less than their copyediting rate, although it’s hovering just a few pennies above the suggested minimum hourly rate (as at the time of this writing). Maybe my decision will be to decline any proofreading from them, but keep on copyediting for them – or maybe I’ll decide to ask for an increased fee, if I otherwise like working for them, and see what happens.
Play around with the filters: in the numerical filters, the above average and below average are useful for deciding who you want to work for less, and who you want to work for more often. The Top Ten option allows you to pick a number other than ten, and the bottom as well as the top of the pile – you could easily find your top three earning jobs, your bottom three earning jobs, or ten jobs, actually up to 500 in either direction, but I suppose ‘Top Ten’ is snappier than the ‘Top or Bottom up to 500’.
Additional help
There are, as you may expect, YouTube videos and other resources on how filtering works. Here’s a small selection:
For PCs
- Microsoft’s instructions on how to apply filters: https://support.microsoft.com/en-us/office/filter-data-in-a-range-or-table-01832226-31b5-4568-8806-38c37dcc180e#ID0EAACAAA=Windows
- This video is by a Microsoft employee: youtube.com/watch?v=BtiVbY7lhqw
- Here’s another guide on filtering, which includes keyboard shortcuts if you prefer those to all-mouse: youtube.com/watch?v=wMlTDXPEjag
- And if you’re very new to spreadsheets, here’s a beginner’s YouTube video: youtube.com/watch?v=k1VUZEVuDJ8
For Macs
- Microsoft’s instructions on how to apply filters: https://support.microsoft.com/en-us/office/filter-a-list-of-data-8ec38534-e2f1-41d0-b8bb-e3f5fcad95a0?ui=en-US&rs=en-US&ad=US
- Some intermediate features, including filters, are covered in this video (if you want to skip to filters, they show up at 19:34): youtube.com/watch?v=Z9sKEjHaIm4
- And if you’re very new to spreadsheets, here’s a beginner’s YouTube video: youtube.com/watch?v=znqfM4ligew
About Sue Littleford
 Sue Littleford is the author of the CIEP guide Going Solo, now in its second edition. She went solo with her own freelance copyediting business, Apt Words, in March 2007 and specialises in scholarly humanities and social sciences.
 About the CIEP
The Chartered Institute of Editing and Proofreading (CIEP) is a non-profit body promoting excellence in English language editing. We set and demonstrate editorial standards, and we are a community, training hub and support network for editorial professionals – the people who work to make text accurate, clear and fit for purpose.
Find out more about:
Photo credits: numbers by Mika Baumeister on Unsplash.
Posted by Abi Saffrey, CIEP blog coordinator.
The views expressed here do not necessarily reflect those of the CIEP.